Debugging Segfault in Tensorflow and Multithreading
segmentation fault (core dumped)
This one-liner error (and no traceback) was all I got while my Tensorflow model crashed in the middle of the run.
This error left me in the dark as all the Stackoverflow solutions didn’t fix it. Furthermore, debugging errors from multithreading or tensorflow alone is already tricky; unknown error from any possible combination of those two could be painful and almost impossible to debug.
I fixed this error somewhat less painfully than I expected with these four different debuggers.
1. Faulthandler
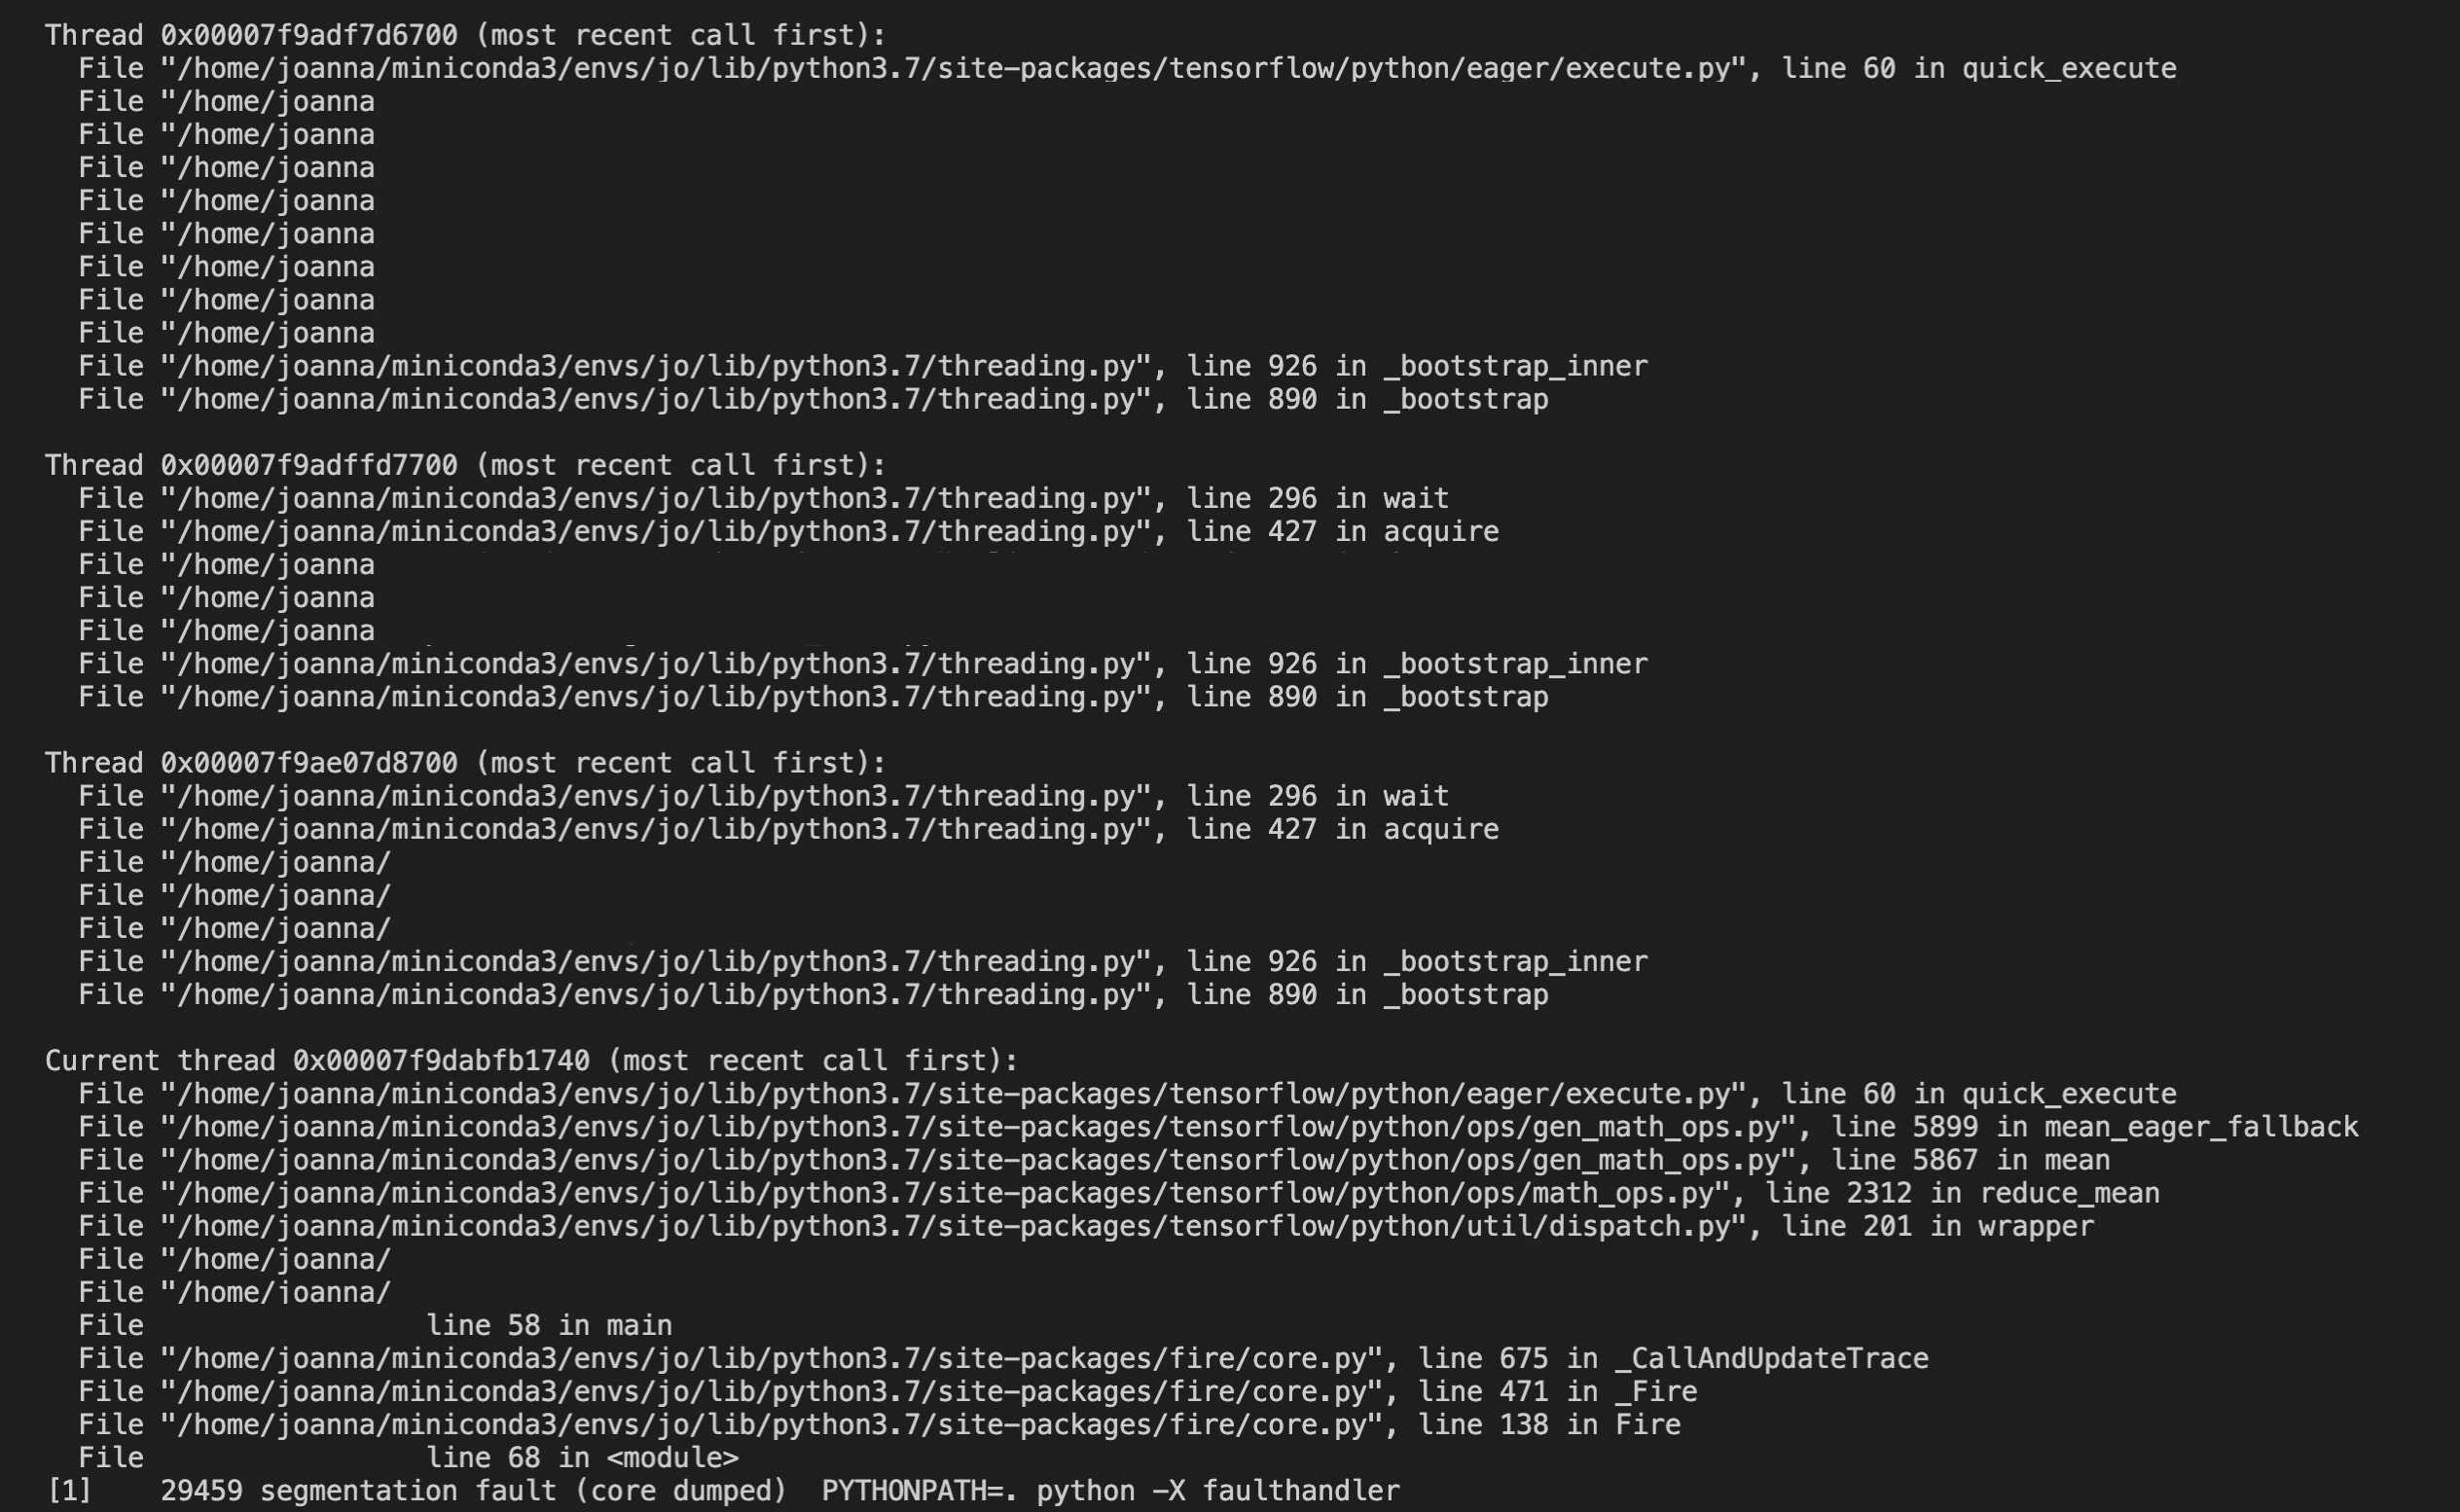
Faulthandler was the debugger that helped me the most. This is a module that dumps Python tracebacks explicitly. The most helpful feature is that it catches and prints tracebacks of all the threads when the error occurs, thus possibly .
How to use
Debugging with faulthandler is very easy. You can import faulthandler and enable it within your script or run it in CLI.
1. Within the script
import faulthandler

def main():
    faulthandler.enable()
2. CLI
python -X faulthandler {... the rest of the command ...}
Outputs
(
Note: Some of the error log is redacted for privacy purposes
)
I ran the program several times with this debugger and found out that there was a thread that had the same traceback throughout the runs. It turned out that the error was happening at totally unexpected lines! THis debugger helped me nail down which thread and which line the error is thrown from.
side note : I wondered why _faulthandler_ is not run as default in Python since it is so useful, fast and easy to use. But then I came across this stackoverflow post. Quote on quote: It is not safe to use faulthandler in case a file descriptor stored by faulthandler is replaced
Documentation
https://docs.python.org/dev/library/faulthandler.html
2. /usr/bin/time
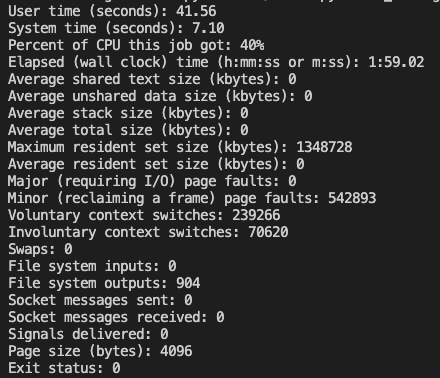
This CLI util gave me a nice overview of how the program exited in details. This util will capture in case you run out of memory (which was not the case for me).
How to use
/usr/bin/time -v python {... the rest of the command ...}
Output
3. gdb
gdb is a powerful debugging tool for programs written in a lot of lower-level languages. Although it had great features and a lot of documentations on how to use this debugger (e.x. DebuggingWithGdb), the outputs were too low-level to actually nail down the error in my case.
Usage
gdb -ex r --args python {... rest of the command}
Output
(Sample output is taken from DebuggingWithGdb)
You can get C stack trace if you use command bt within gdb.
#0  0x0000002a95b3b705 in raise () from /lib/libc.so.6
#1  0x0000002a95b3ce8e in abort () from /lib/libc.so.6
#2  0x00000000004c164f in posix_abort (self=0x0, noargs=0x0)
    at ../Modules/posixmodule.c:7158
#3  0x0000000000489fac in call_function (pp_stack=0x7fbffff110, oparg=0)
    at ../Python/ceval.c:3531
#4  0x0000000000485fc2 in PyEval_EvalFrame (f=0x66ccd8)
    at ../Python/ceval.c:2163
You can also trace each thread with info threads
  Id   Target Id         Frame
  37   Thread 0xa29feb40 (LWP 17914) "NotificationThr" 0xb7fdd424 in __kernel_vsyscall ()
  36   Thread 0xa03fcb40 (LWP 17913) "python2.7" 0xb7fdd424 in __kernel_vsyscall ()
  35   Thread 0xa0bfdb40 (LWP 17911) "QProcessManager" 0xb7fdd424 in __kernel_vsyscall ()
  34   Thread 0xa13feb40 (LWP 17910) "python2.7" 0xb7fdd424 in __kernel_vsyscall ()
  33   Thread 0xa1bffb40 (LWP 17909) "python2.7" 0xb7fdd424 in __kernel_vsyscall ()
  31   Thread 0xa31ffb40 (LWP 17907) "QFileInfoGather" 0xb7fdd424 in __kernel_vsyscall ()
  30   Thread 0xa3fdfb40 (LWP 17906) "QInotifyFileSys" 0xb7fdd424 in __kernel_vsyscall ()
  29   Thread 0xa481cb40 (LWP 17905) "QFileInfoGather" 0xb7fdd424 in __kernel_vsyscall ()
  7    Thread 0xa508db40 (LWP 17883) "QThread" 0xb7fdd424 in __kernel_vsyscall ()
  6    Thread 0xa5cebb40 (LWP 17882) "python2.7" 0xb7fdd424 in __kernel_vsyscall ()
  5    Thread 0xa660cb40 (LWP 17881) "python2.7" 0xb7fdd424 in __kernel_vsyscall ()
  3    Thread 0xabdffb40 (LWP 17876) "gdbus" 0xb7fdd424 in __kernel_vsyscall ()
  2    Thread 0xac7b7b40 (LWP 17875) "dconf worker" 0xb7fdd424 in __kernel_vsyscall ()
* 1    Thread 0xb7d876c0 (LWP 17863) "python2.7" 0xb7fdd424 in __kernel_vsyscall ()
4. pprof
I tried pprof as well but either profiling took too long to finish or it didn’t give relevant information about segfault. Of course this makes sense as pprof if more for visualization of data.